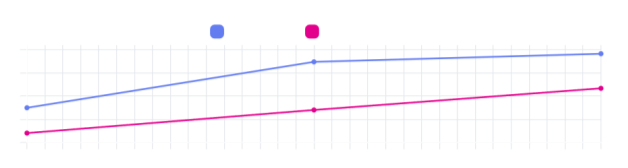
Here’s a quick visual of Brent vs WTI around the current escalation. The chart highlights 28 February 2026 (the day after the US–Israel strikes on Iran) to show how prices reacted.
What’s plotted (sourced snapshots)
- 27 February 2026 (pre-escalation settle): Brent $72.48/bbl, WTI $67.02/bbl.
- 01 March 2026 (early Asian trade / Sunday night US): Brent briefly reached $82.37/bbl; WTI traded around $72/bbl. Petroleum prices reacted to economic and geopolitical uncertainty
- 03 March 2026 (latest snapshot): Brent $84.13/bbl; WTI $76.67/bbl. Asia-Pacific outlook darkens as tensions jolt markets
- Event marker – 28 February 2026: Conflict escalation disrupted shipping routes and pushed a “war premium” into global oil prices. Iran conflict has financial markets preparing for oil price shock